Quick guide to Bienvisto:
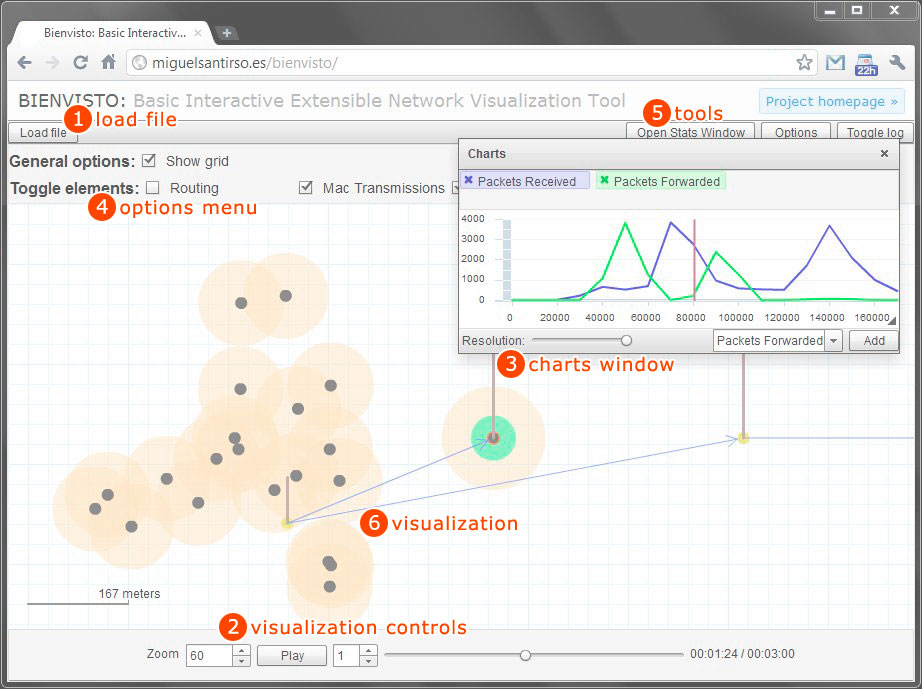
1.- Load file
Load a trace file into the visualization tool.
When clicked, the user will be asked to select a trace file from its filesystem and the tool will begin to load it. For big simulations it can took several seconds to load but it is possible to start visualizing instantly, while the trace file is being loaded.
2.- Visualization controls
Zoom, playback speed and time control.
The visualization tools provide several options to control the visualization. From left to right the user will find zoom control, the play/pause button, the playback speed, the time slider and the exact time indicator. It is possible to drag the handle of the time slider to move quickly through the simulation. You can move the camera by clicking and dragging while pressing the control key.
3.- Charts window
Represent variables in charts.
The charting system will display the charts in these floating windows that can be moved around and resized with the resize handle in the bottom right corner. To add a new variable to the chart, select it from the drop-down list and click "add".
4.- Options menu
Options to toggle the visibility of the elements and the grid.
You can toggle the visibility of the elements at any time during the visualization to make everything clearer. The options menu also contais the option to show or hide the grid.
5.- Tools
Open the additional tools of Bienvisto.
There are three additional buttons in the top right corner of the screen. The first button opens a new, blank chart window, the second one opens and hides the options menu and the last one shows or hides the information log.
6.- Visualization
Visualization area.
The visualization is displayed in the central area of the tool. Remember that you can move the camera by clicking and dragging in the visualization area while pressing the control key.
Understanding the visualizations:
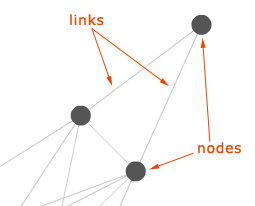
Topology of the network
The nodes are represented by dark grey circles. The thin, light grey lines are the links between the nodes.
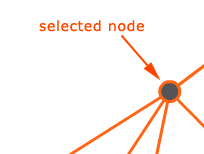
Click a node (or a group of them) to select them. Click again to deselect.
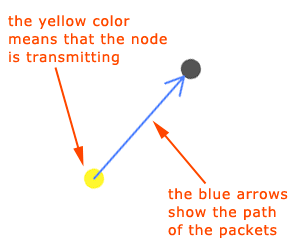
Transmission of packets
Node blinking = node transmitting.
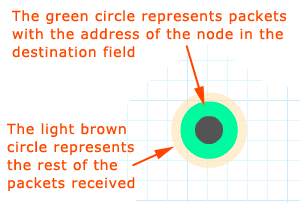
Reception of packets
The number of packets received is represented by two circles around each node.
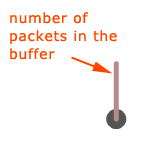
Buffers
The brown bar represents the number of packets in the buffer of a node.